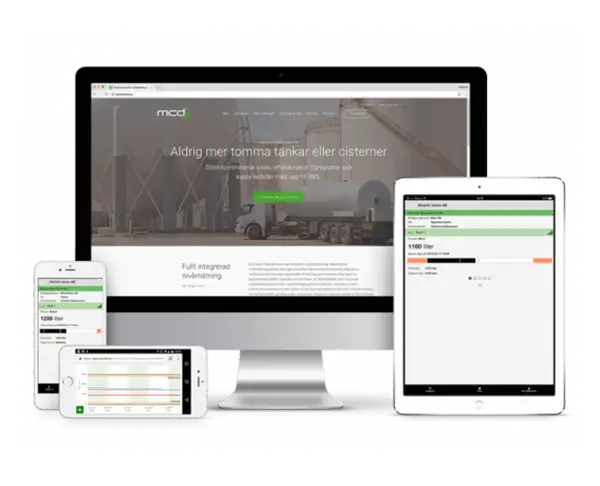
Fully integrated level monitoring that streamlines transport, cuts lead times and eliminates wastage
SiteInfo is a cloud-based level monitoring service that makes your logistics simpler and more cost-effective. Via any computer, tablet or mobile phone, regardless of the time, you can read a lot of information regarding your tanks. Without the need for on-site staff, you will immediately find out about current volumes. You avoid empty cisterns, unnecessary deliveries and costly returns.
Elimination of emergency deliveries – increased customer satisfaction and fulfillment of agreements
Elimination of returns – reduced costs and optimization of the degree of filling
Fewer telephone calls for orderers – lower administrative costs
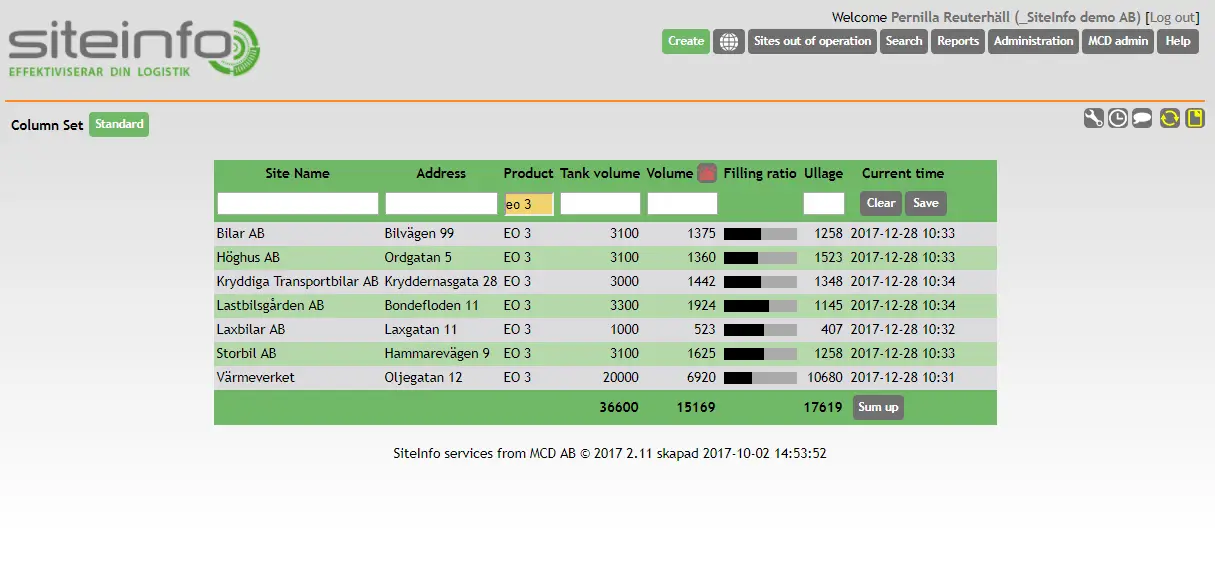
A simple reading of all of your tanks and storage tanks
After logging in, all facilities connected to the service are presented.
You get a quick overview of all your delivery locations and related information. How and what is displayed can be adjusted according to your own wishes; for example, plant name, location or product. As the number of connected facilities grows, you can easily sort out information by combining column selection and filtering.
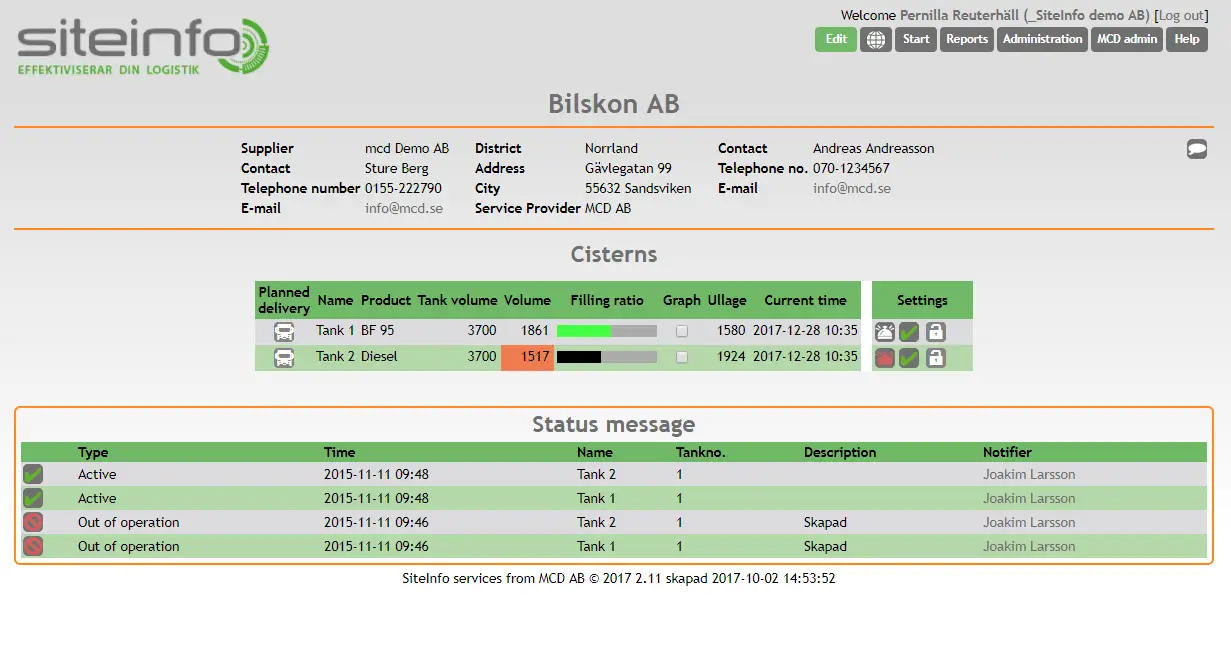
Do you want an email when the level starts to drop? You can easily configure this for each cistern.
The history is saved hour by hour and presented both as a table and a graph.
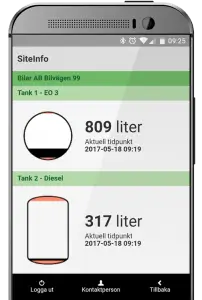
You can read the levels everywhere
With SiteInfoApp you can read the ceiling levels wherever you are. The app is developed for you as an end user and connects the functions. It costs nothing extra but is a service we offer to give you a smarter everyday life.
SiteInfoApp, like the browser version of SiteInfo, can be customized with your company logo. Feel free to contact us and we will tell you more about the possibilities.
Graph and forecast
In the graph, you get a historical overview of the consumption in the tank where you choose which time period you want to see.
In the graph you can see the alarm and warning levels set for the tank as well as protection volume and dead volume.
Collected level data provides detailed statistics about the facility. Among other things, you can see how much has been consumed on average per day, and the deliveries that have taken place within the selected time period. Based on the history, you can use the graph tool to activate and work with consumption forecasts.
Reports that are easy to read and export
SiteInfo contains standard reports such as inventory report and volume history. The reports are displayed on screen but can also be exported to Excel.
Through column selection and filtering in list mode, you can easily produce your own report documents.
SiteInfo gives you a full overview
As a user with administrator rights, you have access to several administrative functions. Among other things, you get an overview of the users who have logins connected to the company. You can see what permissions the user has and you can create new users. You have the authority to edit facilities, users, contacts and products.
SiteInfo also gives you the opportunity to see your selection of tanks clearly with alarm or warning levels in a mapping tool.
Here you can see and read more about how our products are used